Quarterly Market Review: Q1 2016
- Gregory Saliba
- May 4, 2016
- 6 min read

U.S. Treasury Bonds: An Alternative Asset?

Investors seem to be in a constant state of searching for investment alternatives. We are all in a certain sense looking for the perfect portfolio diversifier. An increasingly popular vehicle is called “liquid alternative” funds which seek to mimic hedge funds in more liquid formats.
Unfortunately, hedge funds have had particularly poor performance combined with heavy fees. The sad case of the MainStay Marketfield fund is just one example of this behavior. Investors yanked nearly $20 billion (or 92%) since 2014 from the largest and most popular “liquid-alternative” mutual fund as losses mounted on bad bets tied to the global economy, according to fund-research firm Morningstar Inc. Assets in the MainStay Marketfield fund have fallen 92% to $1.75 billion from a February 2014 peak of $21.5 billion. Annual fees, depending on share class, are between 2.33% and 3.37% for this great performance.
This year has been especially painful for equity investors as global equities have pretty much been in a lockstep, all year long.
If only there were an asset class that possessed little (or no) credit risk and had a tendency to outperform when equities tanked? If only… Wait there is an asset class just like that. It’s called US Treasuries. US Treasury bonds are clearly interesting in a portfolio context. In addition to providing a real return, plus an expected inflation return, the asset serves as a quasi-insurance policy: When stock markets blow up, US bonds tend to do well, on average.
The resilience of this finding is remarkable. In the context of a traditional asset pricing model, such as the Capital Asset Pricing Model (CAPM), an asset that actually delivers returns when the rest of the world is blowing up (I.e., negative beta during treacherous times), should have a negative expected return because of the diversification benefits.
But with US Treasury Bonds, we actually earn a positive expected return AND get the insurance benefit. One might even consider the US Treasury bond “anomalous.” In 2016 it has certainly been the case that US Treasuries have served as a hedge against a rocky stock market. Below you can see the positive performance of bonds (Blue line) vs. stocks YTD.

Source: Yahoo Finance
It is ironic that going into 2016 much investor angst was focused on bonds and the threat of further Fed rate hikes. While I think it’s reasonable to lower your expectations for bond market returns and allow for higher volatility because of the level of rates, it seems to me that many of the fears about fixed income are overblown.
Investors just have to make sure they define their reasons for investing in bonds in the first place. High quality bonds can still be used for principal protection and as a hedge against stock market risk. U.S. Treasury bonds may not in any sense of the word be “alternative” or “hedge-fund like”, but they do serve as an appropriate and, perhaps, best alternative for equity-centric portfolios.
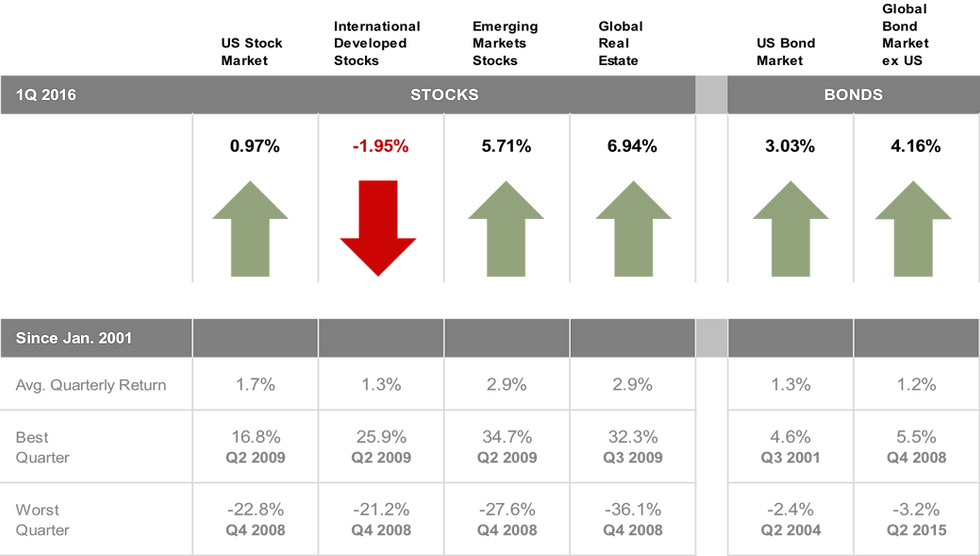
Market Summary First Quarter 2016 Index Returns

Past performance is not a guarantee of future results. Indices are not available for direct investment. Index performance does not reflect the expenses associated with the management of an actual portfolio. Market segment (index representation) as follows: US Stock Market (Russell 3000 Index), International Developed Stocks (MSCI World ex USA Index [net div.]), Emerging Markets (MSCI Emerging Markets Index [net div.]), Global Real Estate (S&P Global REIT Index), US Bond Market (Barclays US Aggregate Bond Index), and Global Bond ex US Market (Citigroup WGBI ex USA 1−30 Years [Hedged to USD]). The S&P data are provided by Standard & Poor's Index Services Group. Russell data © Russell Investment Group 1995–2016, all rights reserved. MSCI data © MSCI 2016, all rights reserved. Barclays data provided by Barclays Bank PLC. Citigroup bond indices © 2016 by Citigroup.
World Stock Market Performance
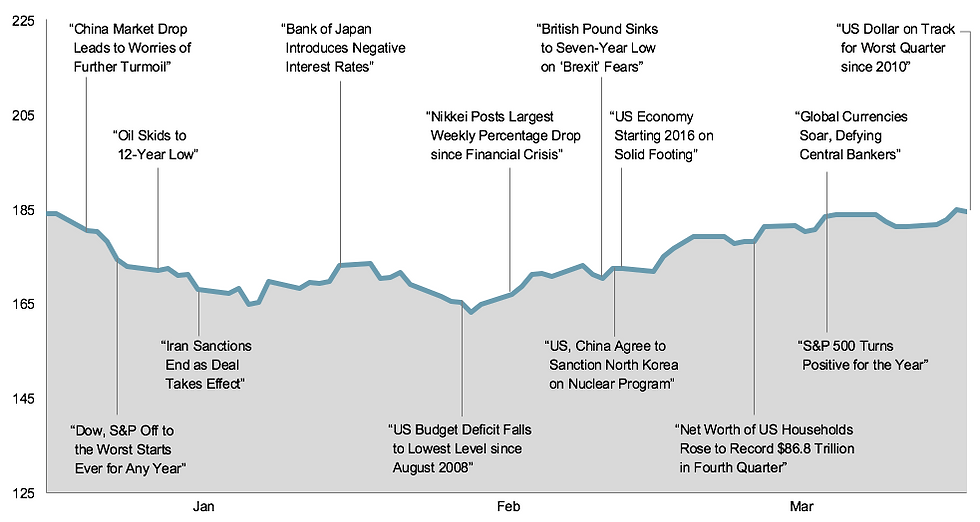
MSCI All Country World Index with selected headlines from Q1 2016

Graph Source: MSCI ACWI Index. MSCI data © MSCI 2016, all rights reserved. It is not possible to invest directly in an index. Performance does not reflect the expenses associated with management of an actual portfolio. Past performance is not a guarantee of future results.
These headlines are not offered to explain market returns. Instead, they serve as a reminder that investors should view daily events from a long-term perspective and avoid making investment decisions based solely on the news.
World Asset Classes
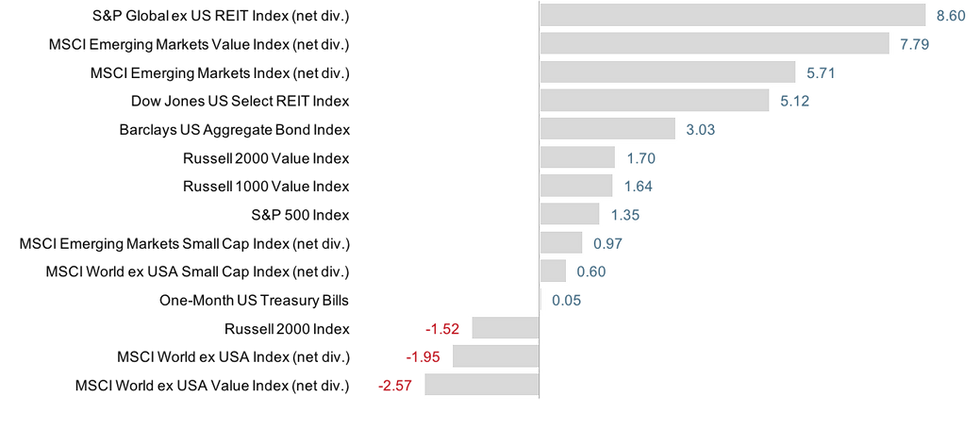
First Quarter 2016 Index Returns
Looking at broad market indices, emerging markets outperformed developed markets, including the US. Developed markets REITs recorded the highest returns.
The value effect was positive in the US and emerging markets but negative in developed markets outside the US. Small caps outperformed large caps in the non-US markets but underperformed in the US and emerging markets.

Past performance is not a guarantee of future results. Indices are not available for direct investment. Index performance does not reflect the expenses associated with the management of an actual portfolio. The S&P data is provided by Standard & Poor's Index Services Group. Russell data © Russell Investment Group 1995–2016, all rights reserved. MSCI data © MSCI 2016, all rights reserved. Dow Jones data (formerly Dow Jones Wilshire) provided by Dow Jones Indexes. Barclays data provided by Barclays Bank PLC.
Real Estate Investment Trusts (REITs)
First Quarter 2016 Index Returns
REITs in developed markets posted very strong performance for the quarter. US REITs outperformed broad market US equity indices.


Past performance is not a guarantee of future results. Indices are not available for direct investment. Index performance does not reflect the expenses associated with the management of an actual portfolio. Number of REIT stocks and total value based on the two indices. All index returns are net of withholding tax on dividends. Total value of REIT stocks represented by Dow Jones US Select REIT Index and the S&P Global ex US REIT Index. Dow Jones US Select REIT Index used as proxy for the US market, and S&P Global ex US REIT Index used as proxy for the World ex US market. Dow Jones US Select REIT Index data provided by Dow Jones ©. S&P Global ex US REIT Index data provided by Standard and Poor's Index Services Group © 2016.
Select Country Performance
First Quarter 2016 Index Returns
Canada recorded the highest country performance in developed markets, while Israel and Italy posted the lowest returns for the quarter. In emerging markets, Brazil and Peru recorded the highest country returns, while China and Greece recording the lowest.


Past performance is not a guarantee of future results. Indices are not available for direct investment. Index performance does not reflect the expenses associated with the management of an actual portfolio. Country performance based on respective indices in the MSCI World ex US IMI Index (for developed markets), Russell 3000 Index (for US), and MSCI Emerging Markets IMI Index. All returns in USD and net of withholding tax on dividends. MSCI data © MSCI 2016, all rights reserved. Russell data © Russell Investment Group 1995–2016, all rights reserved. UAE and Qatar have been reclassified as emerging markets by MSCI, effective May 2014.
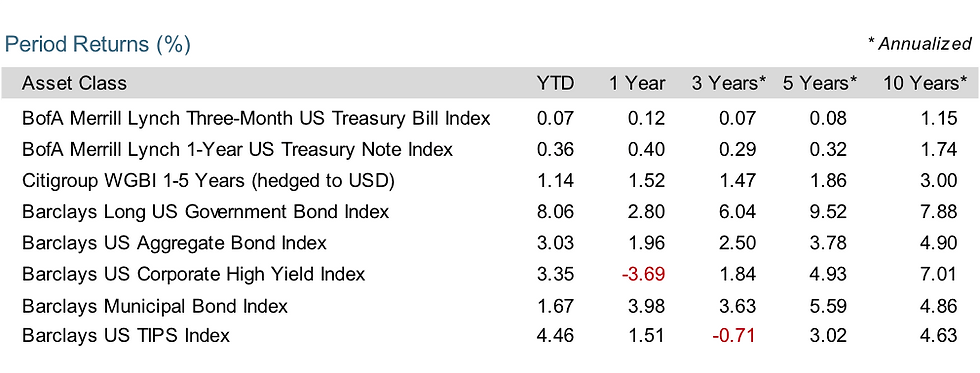
Fixed Income
First Quarter 2016 Index Returns
Interest rates across the US fixed income markets generally decreased during the quarter. The yield on the 5-year Treasury note fell 55 basis points (bps) to 1.21%. The yield on the 10-year Treasury note declined 49 bps to 1.78%. The 30-year Treasury bond declined 40 bps to finish at 2.61%.
The yield on the 1-year Treasury bill dipped 6 bps to 0.59%, and the 2-year Treasury note declined 33 bps to 0.73%. The 3-month T-bill increased 5 bps to yield 0.21%, while the 6-month T-bill decreased 10 bps to 0.39%.
Short-term corporate bonds gained 1.16%, intermediate-term corporate bonds returned 2.76%, and long-term corporate bonds returned 6.83% (Source: Barclays US Corporate Bond Index).
Short-term municipal bonds returned 0.71% while intermediate-term munis gained 1.55%. Revenue bonds slightly outperformed general obligation bonds for the quarter (Source: Barclays Municipal Bond Index).


Past performance is not a guarantee of future results. Indices are not available for direct investment. Index performance does not reflect the expenses associated with the management of an actual portfolio. Yield curve data from Federal Reserve. State and local bonds are from the Bond Buyer Index, general obligation, 20 years to maturity, mixed quality. AAA-AA Corporates represent the Bank of America Merrill Lynch US Corporates, AA-AAA rated. A-BBB Corporates represent the Bank of America Merrill Lynch US Corporates, BBB-A rated. Barclays data provided by Barclays Bank PLC. US long-term bonds, bills, inflation, and fixed income factor data © Stocks, Bonds, Bills, and Inflation (SBBI) Yearbook™, Ibbotson Associates, Chicago (annually updated work by Roger G. Ibbotson and Rex A. Sinquefield). Citigroup bond indices © 2016 by Citigroup. The BofA Merrill Lynch Indices are used with permission; © 2016 Merrill Lynch, Pierce, Fenner & Smith Incorporated; all rights reserved. Merrill Lynch, Pierce, Fenner & Smith Incorporated is a wholly owned subsidiary of Bank of America Corporation.
This report was prepared by Gregory Saliba.

Gregory Saliba
President, Taurus Capital Management
(503) 756-2972
Background:
20 years in Corporate Finance and Investment Management
Investment Management
Debt Capital Markets
Corporate Finance
2010 Oregon Ethics in Business Award Recipient
Public Speaker on Risk, Behavioral Finance and Ethics
Finance Faculty Member (12 years)
Willamette University, Atkinson School of Business
Portland State University School of Business
Extensive Community Involvement


Comments