Quarterly Market Review: Q3 2017
- Oct 13, 2017
- 8 min read

The Meaning, If Any, Of All-Time Highs
"Far more money has been lost by investors preparing for corrections, or trying to anticipate corrections, than has been lost in corrections themselves." – Peter Lynch
One of my earliest conversations about investment markets occurred in 1990 when I worked as a summer intern at a financial firm in Los Angeles. The Dow Jones Average was about to breach the “magical” 3,000-point level. Many were commenting that 3,000 was such a “big” number and because of this fact alone, the market was too pricey and therefore should be suspect. Sure enough, the marked peaked at 2,999.75 that summer and it wasn’t until April 1991 that the market finally closed above 3,000. Here we are today, with the Dow well above 22,000… and this highlights two points: 1) Never underestimate the power of investor psychology and 2) In the end, 3,000 was a meaningless number… as is 22,000 today.
From a psychological perspective, investors give meaning to numbers because we like to oversimplify. 3,000 is a round number and reaching that figure was given undue meaning. Investors want the market to go up. That is how we make money! But simultaneously, our anxiety climbs with the market, as our fear of losing what we have gained increases.
There is a theory in Behavioral Finance called Prospect Theory which states that human beings tend to fear loss twice as intensely as we derive joy from gains. Why? Back in our cave-dwelling origins, loss was particularly hard on our ancestors. The slightest change in weather, hunting success or access to basic life necessities could mean a catastrophic end, so we are wired to worry much more about potential negative outcomes. As a result, when investors’ optimism gives way to fear, a common result is that investors start to sell.
This emotional reaction is buttressed by another concept called Gambler’s Fallacy, whereby people innately believe that random occurrences will naturally balance out within shorter periods of time. Think of a ball on the roulette wheel that lands on red five times in a row. People tend to overweight their expectations for black to be the next result (“surely it has to be black this time!”), even though each spin is its own independent action and has the same probability as any other spin. Just because the market goes up five days in a row does not necessarily mean the odds of the market going down grow greater each day.
When markets hit new highs, investor fear tends to increase. However, markets have gone up for over 100 years, though clearly not in a straight line. Since 2013, the markets have reached a new high 168 times! Of those new highs achieved, 99.4% (167 of the 168) were not a sign of imminent decline, but rather, of greater new highs to come. Only one of those 168 highs was followed by a market decline over 10%, and even that only lasted about 6 weeks before new highs were achieved again. Naturally, for a period of time, a new high will be met with declines – the problem is knowing which new high is the last one for that current climb in the market.
Warren Buffett, always the optimist, recently predicted the Dow would reach 1,000,000 in 100 years. That sounds extraordinary when looking at raw numbers, but if you do the math, reaching a Dow Jones Average of 1 million only requires an average annual return of about 3.86%. This is well below the historic average for the market and would require many new highs between now and 2117.
So, while our DNA and 100,000 years of evolutionary programming may lead us to believe that a new all-time high is a precarious perch and presages an imminent turn in the other direction, it isn’t ever quite that simple. Many new all-time highs are merely stepping stones toward the next set of new all-time highs. This is not a call for complacency, but rather an acknowledgement that market volatility exists and the effort to time that volatility is fruitless.
Going back to the quote I opened with, the worst of a market correction is not actually the correction itself – it’s the mistakes investors make when trying to anticipate (and/or avoid) a market correction. None of us knows what the future holds, but what is known is that fear and speculation around “new highs” can often lead to poor decision-making. Decisions like trying to time the market often cause the most damage to an investor’s portfolio. What do we advise you to do? Try to avoid the hype and the fear. Our job is to give your portfolio an appropriate amount of risk – and with that, volatility – for your time horizon and circumstances, knowing that markets can and will fluctuate. Our job is also to help you stay disciplined, and avoid the very costly mistakes caused by hype and fear. We are in this together, and if you have any questions, we are always available!
Economic Indicators at a Glance
Below you’ll find a snapshot of some top-line economic indicators, followed by the Quarterly Market Review.

Data source: Trading Economics. 2017.
Market Summary Third Quarter 2017 Index Returns

Past performance is not a guarantee of future results. Indices are not available for direct investment. Index performance does not reflect the expenses associated with the management of an actual portfolio. Market segment (index representation) as follows: US Stock Market (Russell 3000 Index), International Developed Stocks (MSCI World ex USA Index [net div.]), Emerging Markets (MSCI Emerging Markets Index [net div.]), Global Real Estate (S&P Global REIT Index), US Bond Market (Barclays US Aggregate Bond Index), and Global Bond ex US Market (Citigroup WGBI ex USA 1−30 Years [Hedged to USD]). The S&P data are provided by Standard & Poor's Index Services Group. Russell data © Russell Investment Group 1995–2017, all rights reserved. MSCI data © MSCI 2017, all rights reserved. Barclays data provided by Barclays Bank PLC. Citigroup bond indices © 2017 by Citigroup.
World Stock Market Performance
MSCI All Country World Index with selected headlines from Q3 2017

These headlines are not offered to explain market returns. Instead, they serve as a reminder that investors should view daily events from a long-term perspective and avoid making investment decisions based solely on the news.
Graph Source: MSCI ACWI Index. MSCI data © MSCI 2017, all rights reserved. It is not possible to invest directly in an index. Performance does not reflect the expenses associated with management of an actual portfolio. Past performance is not a guarantee of future results.
World Asset Classes
Third Quarter 2017 Index Returns (%)
With broad market indices used as proxies, emerging markets outperformed developed markets, including the US, during the quarter. The value effect was positive in non-US developed markets but negative in the US and emerging markets. Small caps outperformed large caps in US and non-US developed markets but underperformed in emerging markets.

Past performance is not a guarantee of future results. Indices are not available for direct investment. Index performance does not reflect the expenses associated with the management of an actual portfolio. The S&P data is provided by Standard & Poor's Index Services Group. Russell data © Russell Investment Group 1995–2017, all rights reserved. MSCI data © MSCI 2016, all rights reserved. Dow Jones data (formerly Dow Jones Wilshire) provided by Dow Jones Indexes. Barclays data provided by Barclays Bank PLC.
U.S. Stocks
Third Quarter 2017 Index Returns
The broad U.S. equity market posted positive returns for the quarter but underperformed both non-U.S. developed and emerging markets. Value underperformed growth indices in the U.S. across all size ranges. Small caps in the U.S. outperformed large caps.

Past performance is not a guarantee of future results. Indices are not available for direct investment. Index performance does not reflect the expenses associated with the management of an actual portfolio. Market segment (index representation) as follows: Marketwide (Russell 3000 Index), Large Cap (Russell 1000 Index), Large Cap Value (Russell 1000 Value Index), Large Cap Growth (Russell 1000 Growth Index), Small Cap (Russell 2000 Index), Small Cap Value (Russell 2000 Value Index), and Small Cap Growth (Russell 2000 Growth Index). World Market Cap represented by Russell 3000 Index, MSCI World ex USA IMI Index, and MSCI Emerging Markets IMI Index. Russell 3000 Index is used as the proxy for the US market. Frank Russell Company is the source and owner of the trademarks, service marks, and copyrights related to the Russell Indexes. MSCI data © MSCI 2017, all rights reserved.
Real Estate Investment Trusts (REITs)
Third Quarter 2017 Index Returns
Non-U.S. real estate investment trusts outperformed U.S. REITs.

Past performance is not a guarantee of future results. Indices are not available for direct investment. Index performance does not reflect the expenses associated with the management of an actual portfolio. Number of REIT stocks and total value based on the two indices. All index returns are net of withholding tax on dividends. Total value of REIT stocks represented by Dow Jones US Select REIT Index and the S&P Global ex US REIT Index. Dow Jones US Select REIT Index used as proxy for the US market, and S&P Global ex US REIT Index used as proxy for the World ex US market. Dow Jones US Select REIT Index data provided by Dow Jones ©. S&P Global ex US REIT Index data provided by Standard and Poor's Index Services Group © 2017.
Select Country Performance
Third Quarter 2017 Index Returns
In U.S. dollar terms, Norway and Italy recorded the highest country performance in developed markets, while Israel posted the lowest—and only negative—return in developed markets. In emerging markets, Brazil, Russia, and Chile posted the highest returns, while Pakistan and Greece had the lowest performance.

Past performance is not a guarantee of future results. Indices are not available for direct investment. Index performance does not reflect the expenses associated with the management of an actual portfolio. Country performance based on respective indices in the MSCI World ex US IMI Index (for developed markets), Russell 3000 Index (for US), and MSCI Emerging Markets IMI Index. All returns in USD and net of withholding tax on dividends. MSCI data © MSCI 2017, all rights reserved. Russell data © Russell Investment Group 1995–2017, all rights reserved. UAE and Qatar have been reclassified as emerging markets by MSCI, effective May 2014.
Fixed Income
Third Quarter 2017 Index Returns
Interest rates increased across the U.S. fixed income market for the quarter. The yield on the 5-year Treasury note increased by 3 basis points (bps) to 1.92%. The yield on the 10-year Treasury note increased by 2 bps to 2.33%. The 30-year Treasury bond yield increased by 2 bps to finish at 2.86%.
The yield on the 1-year Treasury bill rose 7 bps to 1.31%, and the 2-year Treasury note yield rose 9 bps to 1.47%. The yield on the 3-month Treasury bill increased 3 bps to 1.06%, while the 6-month Treasury bill yield increased 6 bps to 1.20%.
In terms of total returns, short-term corporate bonds gained 0.59%, and intermediate-term corporates gained 1.05%.
Short-term municipal bonds generated a total return of 0.49%, while intermediate-term municipal bonds returned 0.83%. General obligation bonds gained 1.14%, outperforming revenue bonds by 4 bps.
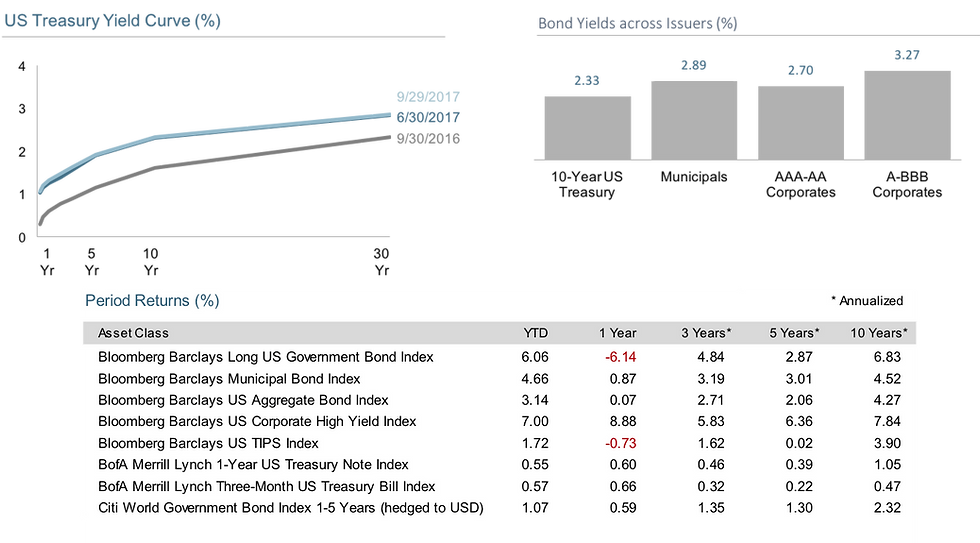
Past performance is not a guarantee of future results. Indices are not available for direct investment. Index performance does not reflect the expenses associated with the management of an actual portfolio. a. Bloomberg Barclays US Corporate Bond Index. b. Bloomberg Barclays Municipal Bond Index. Yield curve data from Federal Reserve. State and local bonds are from the Bond Buyer Index, general obligation, 20 years to maturity, mixed quality. AAA-AA Corporates represent the Bank of America Merrill Lynch US Corporates, AA-AAA rated. A-BBB Corporates represent the Bank of America Merrill Lynch US Corporates, BBB-A rated. Bloomberg Barclays data provided by Bloomberg. US long-term bonds, bills, inflation, and fixed income factor data © Stocks, Bonds, Bills, and Inflation (SBBI) Yearbook™, Ibbotson Associates, Chicago (annually updated work by Roger G. Ibbotson and Rex A. Sinquefield). Citigroup bond indices © 2017 by Citigroup. The BofA Merrill Lynch Indices are used with permission; © 2017 Merrill Lynch, Pierce, Fenner & Smith Incorporated; all rights reserved. Merrill Lynch, Pierce, Fenner & Smith Incorporated is a wholly owned subsidiary of Bank of America Corporation.
This report was prepared by Gregory Saliba.

Gregory Saliba
President, Taurus Capital Management
(503) 756-2972
20+ years in Corporate Finance, Debt Capital Markets and Investment Management
2010 Oregon Ethics in Business Award Recipient
Public Speaker on Risk, Behavioral Finance and Ethics
Finance Faculty Member (12 years)
Willamette University, Atkinson Graduate School of Management
Portland State University, School of Business Administration
Extensive Community Involvement


Comments